When you pick up a generic pill at the pharmacy, you expect it to work just like the brand-name version. But how do regulators know it’s the same? The answer lies in something called dissolution profile comparison-a quiet but powerful tool that decides whether a generic drug can be approved without testing it in people.
What Dissolution Profiles Actually Measure
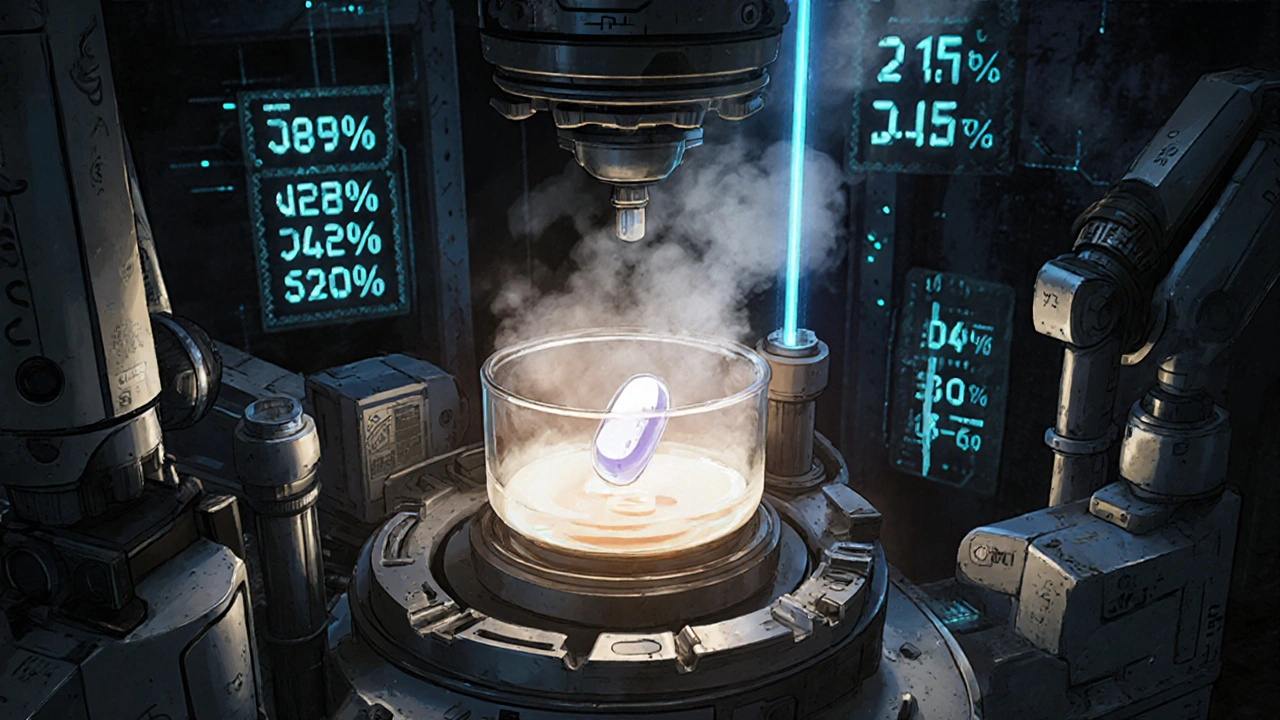
Dissolution testing isn’t about how fast a pill breaks down in your stomach. It’s about how quickly the active ingredient comes out of the tablet or capsule under controlled lab conditions. Imagine placing a tablet in a beaker of liquid that mimics your digestive system-warm, slightly acidic, and gently stirred. Over time, you measure how much of the drug dissolves at 10, 20, 30, 45, and 60 minutes. That sequence of numbers? That’s the dissolution profile.
For brand-name drugs, this profile is established during development. When a company makes a generic version, they must match that profile as closely as possible. If the generic releases the drug too fast, too slow, or unevenly, it might not work the same way in your body-even if the chemical formula is identical.
Why This Matters More Than You Think
Here’s the catch: two pills can have the same active ingredient, same dose, same excipients-and still behave differently in your body. Why? Because of how the drug is formulated. The particle size, the coating, the binding agents, even the compression force during manufacturing can change how quickly the drug dissolves. A generic made with a different binder might release 80% of its drug in 15 minutes, while the brand takes 30. That difference might seem small, but for drugs with narrow therapeutic windows-like warfarin or levothyroxine-it can mean the difference between underdosing and overdose.
That’s why regulators don’t just look at the final number. They look at the whole curve. A pill that hits 85% dissolution at 45 minutes might seem fine, but if it spikes to 70% in the first 10 minutes, that’s a red flag. Rapid early release can cause side effects. Slow release might mean the drug never reaches effective levels.
The f2 Factor: The Industry Standard
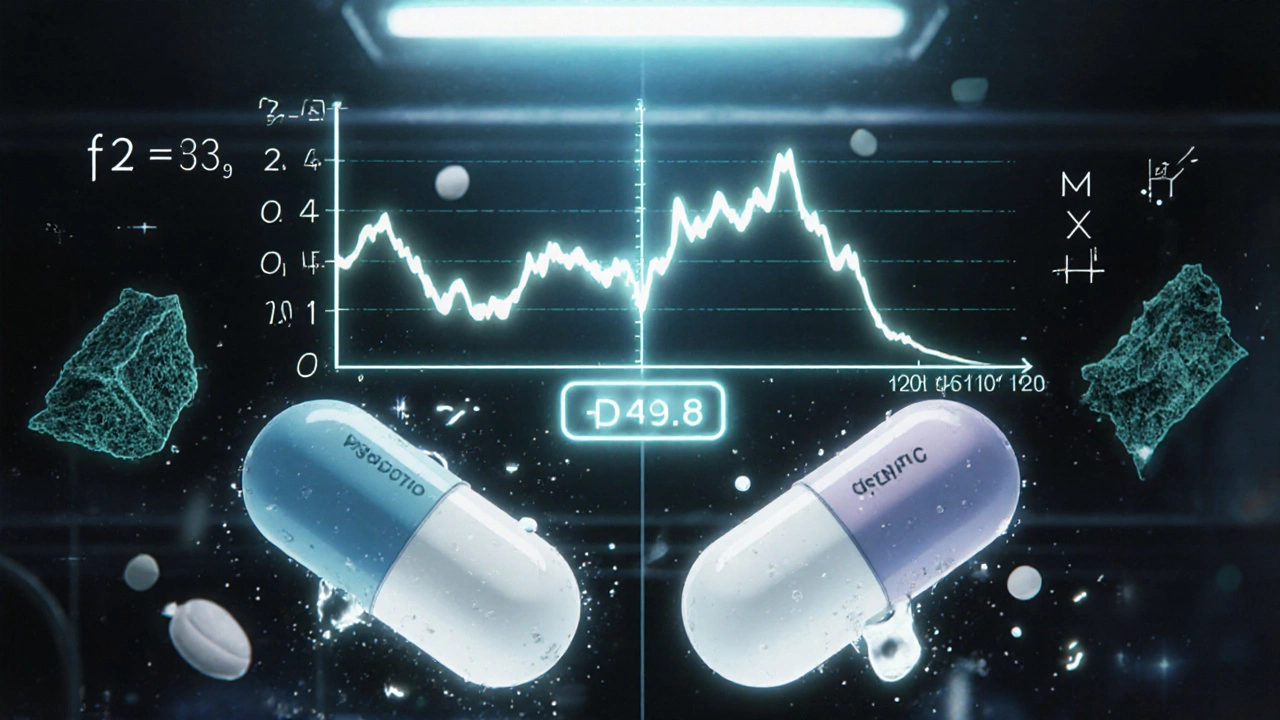
The most widely accepted way to compare two dissolution profiles is the f2 similarity factor. Developed in 1996 and now used in over 90% of FDA submissions, it’s a mathematical formula that compares the percentage dissolved at each time point between the test (generic) and reference (brand) product.
The math looks like this:
f2 = 50 × log10 { [1 + (1/n) × Σ (Rt − Tt)²]−0.5 × 100 }
Don’t panic. You don’t need to calculate it yourself. What matters is the result: f2 must be between 50 and 100. A score of 100 means the profiles are identical. A score of 50 is the minimum acceptable threshold. Below that? The profiles are considered too different.
But here’s where things get tricky. In 2022, a study of 1,450 generic drug applications found that 18% of products with f2 scores between 48 and 50 still performed identically in clinical trials. That’s because f2 is a blunt tool-it doesn’t care if the curves cross, if one releases faster early on, or if the shape looks different. It just adds up the differences. That’s why experts now say: f2 ≥ 50 is necessary, but not enough.
When f2 Isn’t Enough
For highly soluble drugs (BCS Class I), the FDA requires dissolution testing in three different pH conditions: stomach acid (pH 1.2), small intestine (pH 4.5), and neutral (pH 6.8). The generic must hit f2 ≥ 60 in all three. Why? Because drugs like amlodipine or metoprolol dissolve easily in all pH levels-but if they dissolve too fast in one, they might not be absorbed properly later.
For drugs with high variability-say, low-dose pills under 5mg-f2 can be unreliable. A single outlier in one of the 12 test units can drag the score down. In these cases, regulators recommend using bootstrap f2 or the Mahalanobis Distance Test. Bootstrap f2 runs the comparison 1,000 times with shuffled data to see if the result holds up. Mahalanobis looks at the entire shape of the curve, not just point-by-point differences. It’s more accurate but needs advanced software and trained statisticians.
One Pfizer scientist shared on a pharma forum that they once had a generic with an f2 score of 49.8-just 0.2 below the line. The product performed perfectly in patients. But because of the rule, they had to reformulate the tablet, adding cost and delaying approval. That’s the downside of rigid thresholds.
What Happens in the Lab
It’s not just about the math. The equipment matters. The FDA requires dissolution testing using USP Apparatus 1 (baskets) or Apparatus 2 (paddles), spinning at 50-100 rpm, at exactly 37°C ± 0.5°C. Vessels must be perfectly aligned. Paddles must wobble less than 1mm. Temperature must be stable within 0.3°C. All of this is verified with NIST-traceable instruments.
Testing uses 12 individual units-not averages. That’s because real patients get individual tablets. If one tablet dissolves too fast, it could cause a problem. The media volume must be large enough to maintain “sink conditions”-meaning the solution doesn’t get saturated. For poorly soluble drugs, surfactants like sodium lauryl sulfate are added to mimic intestinal fluids.
And the method must be discriminatory. That means you need to prove it can detect differences. You do this by intentionally stressing samples-overheating tablets, compressing them too lightly, or aging them. If the method can’t tell the difference between a stressed tablet and a normal one, it’s not good enough.

Real-World Impact: Cost, Time, and Access
Without dissolution profile comparison, every generic drug would need a full bioequivalence study-testing in healthy volunteers, drawing blood, measuring drug levels over time. That costs $2-5 million and takes 12-18 months. With dissolution testing? It can cost under $500,000 and take 6-9 months.
That’s why 78% of generic applications submitted to the FDA in 2022-2023 used dissolution profile comparison. It’s the reason why a 25mg amlodipine tablet from Teva got approved faster and cheaper than if they’d done a full clinical trial. It’s why you can buy generic metformin for $4 instead of $200.
Regulatory agencies worldwide-FDA, EMA, Health Canada, WHO-all accept this method. Approval rates for biowaivers based on dissolution similarity have jumped from 68% in 2015 to 84% in 2023. The global dissolution testing market is growing at 7.2% a year. Why? Because it works.
The Future: Smarter, Not Harder
The next wave is smarter testing. The FDA’s 2023 draft guidance introduces tiered criteria: f2 ≥ 65 for drugs with narrow therapeutic windows (like digoxin or phenytoin), and f2 ≥ 50 for others. That’s a big shift-from a one-size-fits-all rule to risk-based judgment.
Biorelevant media is also gaining ground. Instead of plain buffer solutions, labs are using fluids that mimic real stomach and intestine contents-adding bile salts, enzymes, and proteins. This gives a truer picture of how the drug will behave in your body.
And now, some companies are using machine learning. By feeding dissolution profiles into AI models trained on thousands of clinical outcomes, they can predict bioequivalence before ever testing in humans. Thirty-seven percent of top pharma companies are piloting this. It’s not replacing f2 yet-but it’s changing how we think about it.
What This Means for You
If you’re a patient, you can trust that your generic drug was tested rigorously. Dissolution profile comparison isn’t a shortcut-it’s a science-backed, globally accepted standard. It’s why your blood pressure medication works the same whether it’s branded or generic.
If you’re a pharmacist or prescriber, understand that dissolution profiles aren’t just paperwork. They’re the bridge between chemistry and clinical effect. When a generic fails dissolution testing, it’s not a paperwork issue-it’s a safety issue.
If you’re in pharma, remember: the goal isn’t just to hit f2 ≥ 50. It’s to match the release pattern. Two profiles can have the same f2 score but different mechanisms-one might dissolve fast then plateau, another might release slowly and steadily. Only the latter mimics the brand. That’s what matters.
What is the f2 similarity factor in dissolution testing?
The f2 similarity factor is a mathematical tool used to compare the dissolution profiles of two drug products, typically a generic and a brand-name version. It calculates the average difference in percentage dissolved at each time point across 12 test units. A score between 50 and 100 indicates similarity, with 100 meaning identical profiles. It’s the most commonly accepted method by regulators like the FDA and EMA.
Why do generics need to match brand-name dissolution profiles?
Even if two pills have the same active ingredient, differences in formulation-like binders, coatings, or particle size-can change how quickly the drug releases in the body. Matching dissolution profiles ensures the generic behaves the same way as the brand, reducing the risk of under- or overdosing. This is especially critical for drugs with narrow therapeutic windows.
Can a generic pass f2 but still be unsafe?
Yes, theoretically. The f2 factor doesn’t account for the shape or timing of the dissolution curve. Two profiles can have the same f2 score but different release patterns-one might release too fast early on, causing spikes in blood levels, while the other releases steadily. Experts now recommend combining f2 with other data, like area under the curve (AUC), to catch these issues. Clinical data shows some products with f2 slightly below 50 still worked fine, but regulators err on the side of caution.
What are the testing conditions for dissolution profiles?
Testing uses USP Apparatus 1 or 2, with 12 individual units tested in identical conditions: 37°C ± 0.5°C, 50-100 rpm, and dissolution media matching physiological pH (typically pH 1.2, 4.5, and 6.8). The volume must maintain sink conditions (at least 3x the drug’s solubility). Time points are selected until at least 85% of the drug dissolves. All equipment must be calibrated with NIST-traceable instruments.
How does dissolution testing help reduce drug costs?
Dissolution profile comparison replaces full bioequivalence studies, which require human volunteers, blood sampling, and complex analysis-costing $2-5 million and taking over a year. Dissolution testing costs under $500,000 and takes 6-9 months. This cuts development time by up to 18 months and reduces costs by 60%, making generic drugs affordable and widely available.
Are there newer methods replacing f2?
Not yet replacing, but supplementing. Bootstrap f2 and Mahalanobis Distance Test are used for highly variable data. Biorelevant media-fluids that mimic real stomach and intestine contents-are becoming standard for certain drugs. Machine learning models trained on clinical outcomes are being piloted to predict bioequivalence from dissolution data. These tools improve accuracy, but f2 remains the regulatory baseline.

Dana Dolan
November 20, 2025 AT 12:49So basically, if your generic pill dissolves at the same rate as the brand, you’re good? Feels like magic, but I guess the science checks out. Still, I’m glad someone’s watching the numbers so I don’t have to worry about my blood pressure meds suddenly turning into a time-release capsule.
Codie Wagers
November 22, 2025 AT 02:59Let me get this straight - we’re trusting a mathematical formula invented in 1996 to determine whether a drug will kill you or save you? That’s not science. That’s a spreadsheet with delusions of grandeur. If you want to know if a drug works, test it in humans. Not in beakers. Not with paddles. In real bodies. That’s what medicine is - not math.
Paige Lund
November 23, 2025 AT 03:13So f2 ≥ 50 is the new ‘close enough’? Sounds like the pharmaceutical version of ‘it’s fine, I’m sure it’s fine.’
Reema Al-Zaheri
November 23, 2025 AT 06:29It is important to note that the f2 similarity factor, while widely adopted, does not account for the kinetic behavior of dissolution curves, nor does it penalize asymmetry or inflection points - which, in clinical contexts, may be critical. Therefore, reliance solely on f2, particularly for narrow-therapeutic-index drugs, is statistically inadequate and potentially hazardous.
Michael Salmon
November 24, 2025 AT 11:43Oh wow, so the FDA lets companies pass generics with a 49.8 f2 score? That’s not a loophole - that’s a goddamn chasm. And you people call this ‘science’? This is corporate theater with lab coats. If your ‘gold standard’ can be beaten by 0.2 points, it’s not a standard - it’s a suggestion.
Joe Durham
November 24, 2025 AT 14:44I get why f2 is used - it’s cheap, fast, and scalable. But I also think we’re underestimating how much real-world variability matters. A pill that hits 85% at 45 minutes might look perfect on paper, but if one person’s stomach is acidic and another’s isn’t? That’s where the real risk hides. Maybe we need more personalized dissolution benchmarks - not just one-size-fits-all math.
Derron Vanderpoel
November 25, 2025 AT 21:50I just took my generic levothyroxine this morning and I swear, I felt like a different person. Not in a bad way - like, my brain finally stopped feeling like it was wrapped in cotton. And now I learn this whole thing is decided by a bunch of beakers and a formula that looks like it was written by a drunk physicist? I’m not mad… I’m just… wow. That’s wild.
river weiss
November 27, 2025 AT 05:28It is essential to recognize that dissolution profile comparison is not a surrogate for bioequivalence - it is a predictive model grounded in decades of empirical correlation between in vitro dissolution and in vivo absorption. The method is validated through thousands of successful generic approvals and is supported by regulatory agencies globally. While newer techniques such as biorelevant media and machine learning are promising, they are complementary - not replacements - for the f2 factor, which remains the most robust, reproducible, and cost-effective tool available for regulatory decision-making.
Brian Rono
November 28, 2025 AT 21:38They call this science? This is a glorified game of connect-the-dots with a calculator. You think a pill that dissolves at the same rate as the brand is the same? Tell that to the guy whose heart started fluttering because his generic warfarin released 20% faster in the first 10 minutes. The f2 score is a lie dressed up in Greek letters. And don’t even get me started on the ‘sink conditions’ - you’re testing drugs in a perfect, sterile, corporate fantasy world. Real stomachs? They’re messy. They’re inconsistent. And your test tubes? They’re not.
seamus moginie
November 29, 2025 AT 22:32Look, I’m no chemist, but I’ve been on generics for 12 years and never had an issue. Maybe the system ain’t perfect, but it works. If it was broken, we’d all be in the ER. Instead, I’m here, paying $4 for my meds instead of $200. So yeah, I’ll take the f2 score, the paddles, and the beakers - as long as it keeps the prices down.
Chuck Coffer
November 30, 2025 AT 20:22Wow. So you’re telling me a company can tweak a binder, change the compression force, and still pass f2 - and you call that ‘equivalent’? That’s not equivalence. That’s corporate fraud dressed up as regulation. And you’re all just nodding along like it’s fine because you’re too lazy to demand real testing. Pathetic.
Marjorie Antoniou
December 2, 2025 AT 05:37I used to think this was all bureaucracy - until my mom had a seizure after switching to a new generic. Turned out the dissolution curve spiked too fast. They fixed it. But if we didn’t have this system, we’d never have known. So yeah - it’s not perfect. But it’s the best shield we’ve got between patients and chaos.
Andrew Baggley
December 3, 2025 AT 12:32It’s not about whether the system is perfect - it’s about whether it’s better than the alternative. Full clinical trials for every generic? That’d make most meds unaffordable. We’re not trying to replicate the brand 100%. We’re trying to make sure it doesn’t kill you. And honestly? The fact that 84% of generics pass this test and work fine? That’s not failure. That’s a win.